
Real floors. Measurable change.
Not feature lists — outcomes. Each story leads with the result, then explains how ExSA delivered it on a live production floor.
Debug Efficiency
Breaking the Cycle: Replacing Manual Debug with Data-Driven Intelligence
Does your team start every debug session the same way — by eliminating possibilities one by one, with no guidance from historical data?
This is still the standard operating procedure in many semiconductor test facilities around the world. And it is expensive: every hour spent guessing is an hour the equipment is not producing.
ExSA changes this. Its graphical drill-down capability gives technicians instant visibility into test results — not just standard counts and yield, but softbin breakdowns by handler arm and by site.
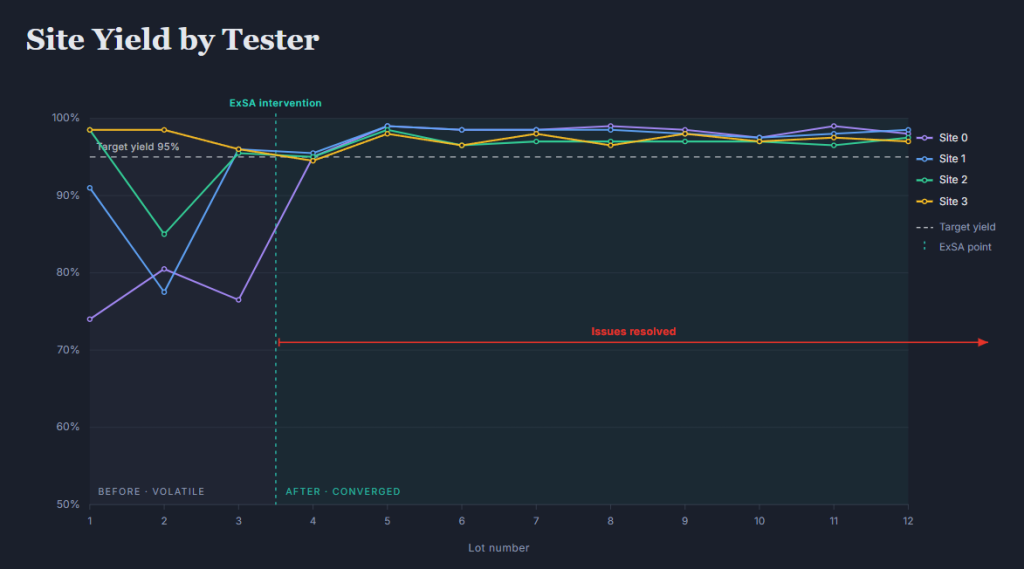
In practice: Lot #2 showed an 18% failure rate in continuity for site 2, and a 17% fallout on the analog test for site 1. With that level of specificity, isolating the issue to the interface board or the contactors takes two mouse clicks. Not two hours.
The result is a faster, more confident debug process — and fewer lots lost to cascading failures that could have been caught earlier.
2 Clicks
To narrow focus from full test floor to a single interface board
Minutes
Time to identify root cause — down from hours of manual elimination
18%
Example: continuity failure on site 2 isolated in 2 clicks
OEE Improvement
Late Shifts and Quick Fixes: A Story of OEE, Culture, and Real Change
1
Root cause: not the machine. The workaround culture.
20%
OEE improvement after ExSA deployment
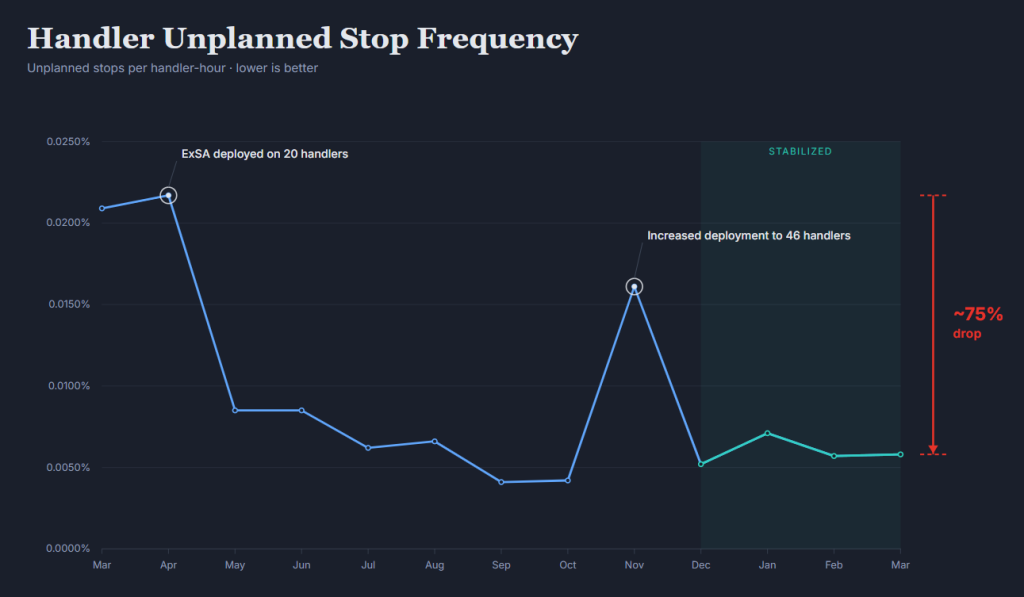
~75%
Drop in handler unplanned stop frequency
OEE improvement does not always come from a hardware upgrade. Sometimes the biggest gains come from making the invisible visible.
Picture a late shift. An alarm keeps firing. The technician — tired, near the end of their shift — does whatever it takes to get the machine running again. A quick fix. A workaround. It works, for now. The next shift inherits the same problem, applies the same workaround. And the cycle continues.
This pattern is common. What makes it hard to fix is that it is invisible — there is no record of it, no aggregate picture of how many times the same machine was reset the same way without a root-cause fix.
With ExSA deployed across 20 handlers, the data told a different story. Unplanned stop frequency was tracked, attributed, and visualised over time. The pattern became undeniable. When deployment was extended to 46 handlers, the same insight applied at scale — and unplanned stop frequency dropped by approximately 75%.
The OEE improvement of 20% did not come from new equipment. It came from knowing what was actually happening, and making it impossible to ignore.
Cost Visibility
Exposing the Real Cost of Test: Insertion Counts Made Visible
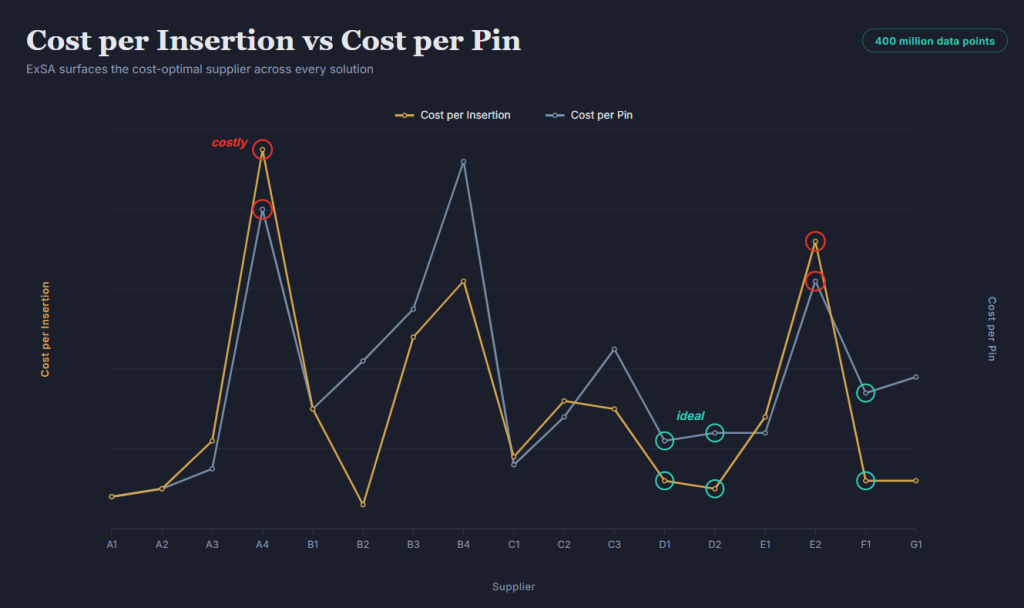
The semiconductor test industry has long modelled pin costs as cost-per-pin. It is a reasonable simplification — but it hides the real cost driver: how many insertions a pin actually delivers before it needs replacing.
Without accurate insertion tracking, the standard approach is to use the manufacturer’s simulated lifespan. But real-world performance varies. Some solutions last far longer than specified. Others fail far earlier.
ExSA tracks insertion counts automatically, across every piece of hardware, building a real-world database. With 400 million datapoints, the gap between simulated and actual lifespan became clear — and in some cases, surprisingly expensive.
The cost-per-insertion model that emerges from this data allows procurement teams to make genuinely informed decisions: which suppliers deliver robust, long-lasting solutions, and which are lemons dressed up in a good specification sheet.
Cost/insertion
New model: actual cost revealed
400M
Real-world datapoints replacing simulated insertion lifespans
Cost/pin
Old model: blind to true cost